Safe boating is the aim of all boaters and comes from education/training
and experience. This excerpt from a recent Boating Statistics report,
provided by the United States Coast Guard, is presented in the interest
of safety by helping boaters learn from the experience of others.
To read the full report, please visit www.uscgboating.org.
FATALITY RATE
Historically, one indicator of safety in recreational boating is
the fatality rate, e.g., the number of reported fatalities as compared
to the number of registered recreational boats. The registered boat
population is based on the annual Report of Certificates of Number
Issued to Boats, each State and jurisdiction forwards to the Coast
Guard. The report also provides statistics on registered boats by
length, hull material, and type of propulsion. Please note there are limitations to this methodology.
One is that fatality rate comparisons between States are invalid
because of differences in the scope of each State's boat registration
system. Another limitation is that fatalities occur on boats which
are not registered, and therefore not included in the boat registration
statistics. Users should be aware of these limitations when working
with the fatality rate. A more reliable estimate of the fatality
rate for each State or jurisdiction can be found by comparing fatalities
occurring only on specific categories of registered boats.
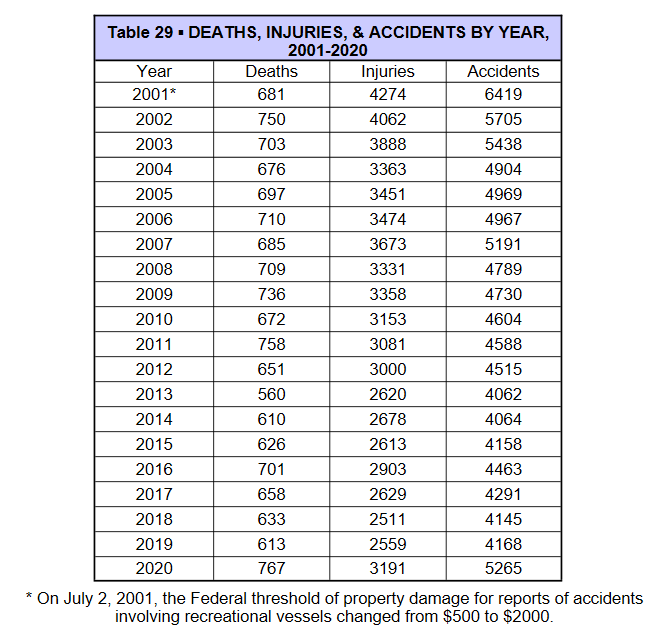
In 2020, the Coast Guard counted 5,265 accidents that involved 767 deaths, 3,191 injuries and approximately $62.5 million dollars of damage to property as a result of recreational boating accidents.
The fatality rate was 6.5 deaths per 100,000 registered recreational vessels.This rate represents a 25% increase from the 2019 fatality rate of 5.2 deaths per 100,000 registered recreational vessels.
Compared to 2019, the number of accidents increased 26.3%, the number of deaths increased 25.1%, and the number of injuries increased 24.7%.
Where cause of death was known, 75% of fatal boating accident victims drowned. Of those drowning victims with reported life jacket usage, 86% were not wearing a lifejacket.
Where length was known, eight out of every ten boaters who drowned were using vessels less than 21 feet in length.
Alcohol use is the leading known contributing factor in fatal boating accidents; where the primary cause was known, it was listed as the leading factor in 18% of deaths.
Where instruction was known, 77% of deaths occurred on boats where the operator did not receive boating safety instruction. Only 12% percent of deaths occurred on vessels where the operator had received a nationally-approved boating safety education certificate.
There were 247 accidents in which at least one person was struck by a propeller. Collectively, these accidents resulted in 39 deaths and 241 injuries.
Operator inattention, operator inexperience, improper lookout, excessive speed, and machinery failure rank as the top five primary contributing factors in accidents.
Where data was known, the most common vessel types involved in reported accidents were open motorboats (46%), personal watercraft (22%), and cabin motorboats (13%).
Where data was known, the vessel types with the highest percentage of deaths were open motorboats (50%), kayaks (15%), and pontoons (9%).
The 11,838,188 recreational vessels registered by the states in 2020 represent a 0.34% decrease from last year when 11,878,542 recreational vessels were registered..
For charts containing the following statistics, click on the individual links below.